
Penrose is the big-data visualization platform for Tencent. Working at the HQ in Shenzhen, Our team were responsible for creating solutions for a wide range of clients. Including Government, AEC and Medical institutions, As well as for Tencent's internal operations.
We worked directly with Epic China to develop the engine to load massive datasets for the Digital China national policy, and Presented our works at Epic summits in Shanghai and London.
Working as the Lead Technical Artist, This project required extensive use of all engine systems for realtime rendering of big-data sets as well as data streaming from remote servers. I worked with management teams to determine project requirements. Built tools / function libraries for developers and implemented a variety of features. Work included:
- Procedurally generating meshes and materials to generate large scale maps. Using C++, Substance Designer, Houdini Engine and Unreal Systems such as Blueprint, Material Editor etc
- Creating classes/blueprints for UI/Navigation, Loading data streams and initializing the simulations with required parameters. JSON Parser for custom syntax/configuration files.
- Training neural networks to integrate with digital twin data streams to optimize operations: Traffic Flow/Energy management, Predictive Maintenance, Air Quality Control. Using Python Libraries: SciKit Learn, NumPy, OpenCV, GeoPandas, TensorFlow to train ONNX models which were ran in Unreal
- Big-Data processing and visualization, Cleaning and Organizing large GIS datasets, such as Satellite Scans, Population Distribution, Map Info etc.
- Unreal Editor Tooling (Python/Editor Utility Widgets) to automate the process of loading and transforming large datasets and creating uassets.
- Application R&D: C-Level applications which interface with proprietary backend APIs over websocket protocol to load and process data to forward to Unreal. Development of stand-alone visualization application using OpenGL/RayLib, Web-based solution in Three.js/PlayCanvas
- Creation of various assets, lighting and scene setup with data from a variety of sources. Including BIM data from Revit/Navisworks, Shapefile Data and USD/FBX Data.
Below is our presentation at RIBA, London on the Penrose Platform.
Case Studies
Cloud Security Operations Centre
3D Security Dashboard. This displays infographics such as DDoS detection, IoT Device status and server traffic (Packet Type, Bandwidth etc)
VR cloud SOC
Web Cloud SOC
Digital China
A Collection of interactive infographics used to promote the Digital China national policy, and services provided by Tencent.
Scene description:
- Tencent PC Manager metrics, and information on virus attacks
- Overview of a TangZhou marathon event, tracking runners using GPS and Biometric data and visualized in the engine
- Shanghai: This scene generates the building geometry by loading shapefile data into the engine and creating procedural meshes, It will also load Tencent Map POI data depending on camera position
- Changsha: CDC medical resources visualization, Used to display available resources across the city, and optimal routing
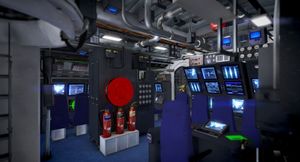
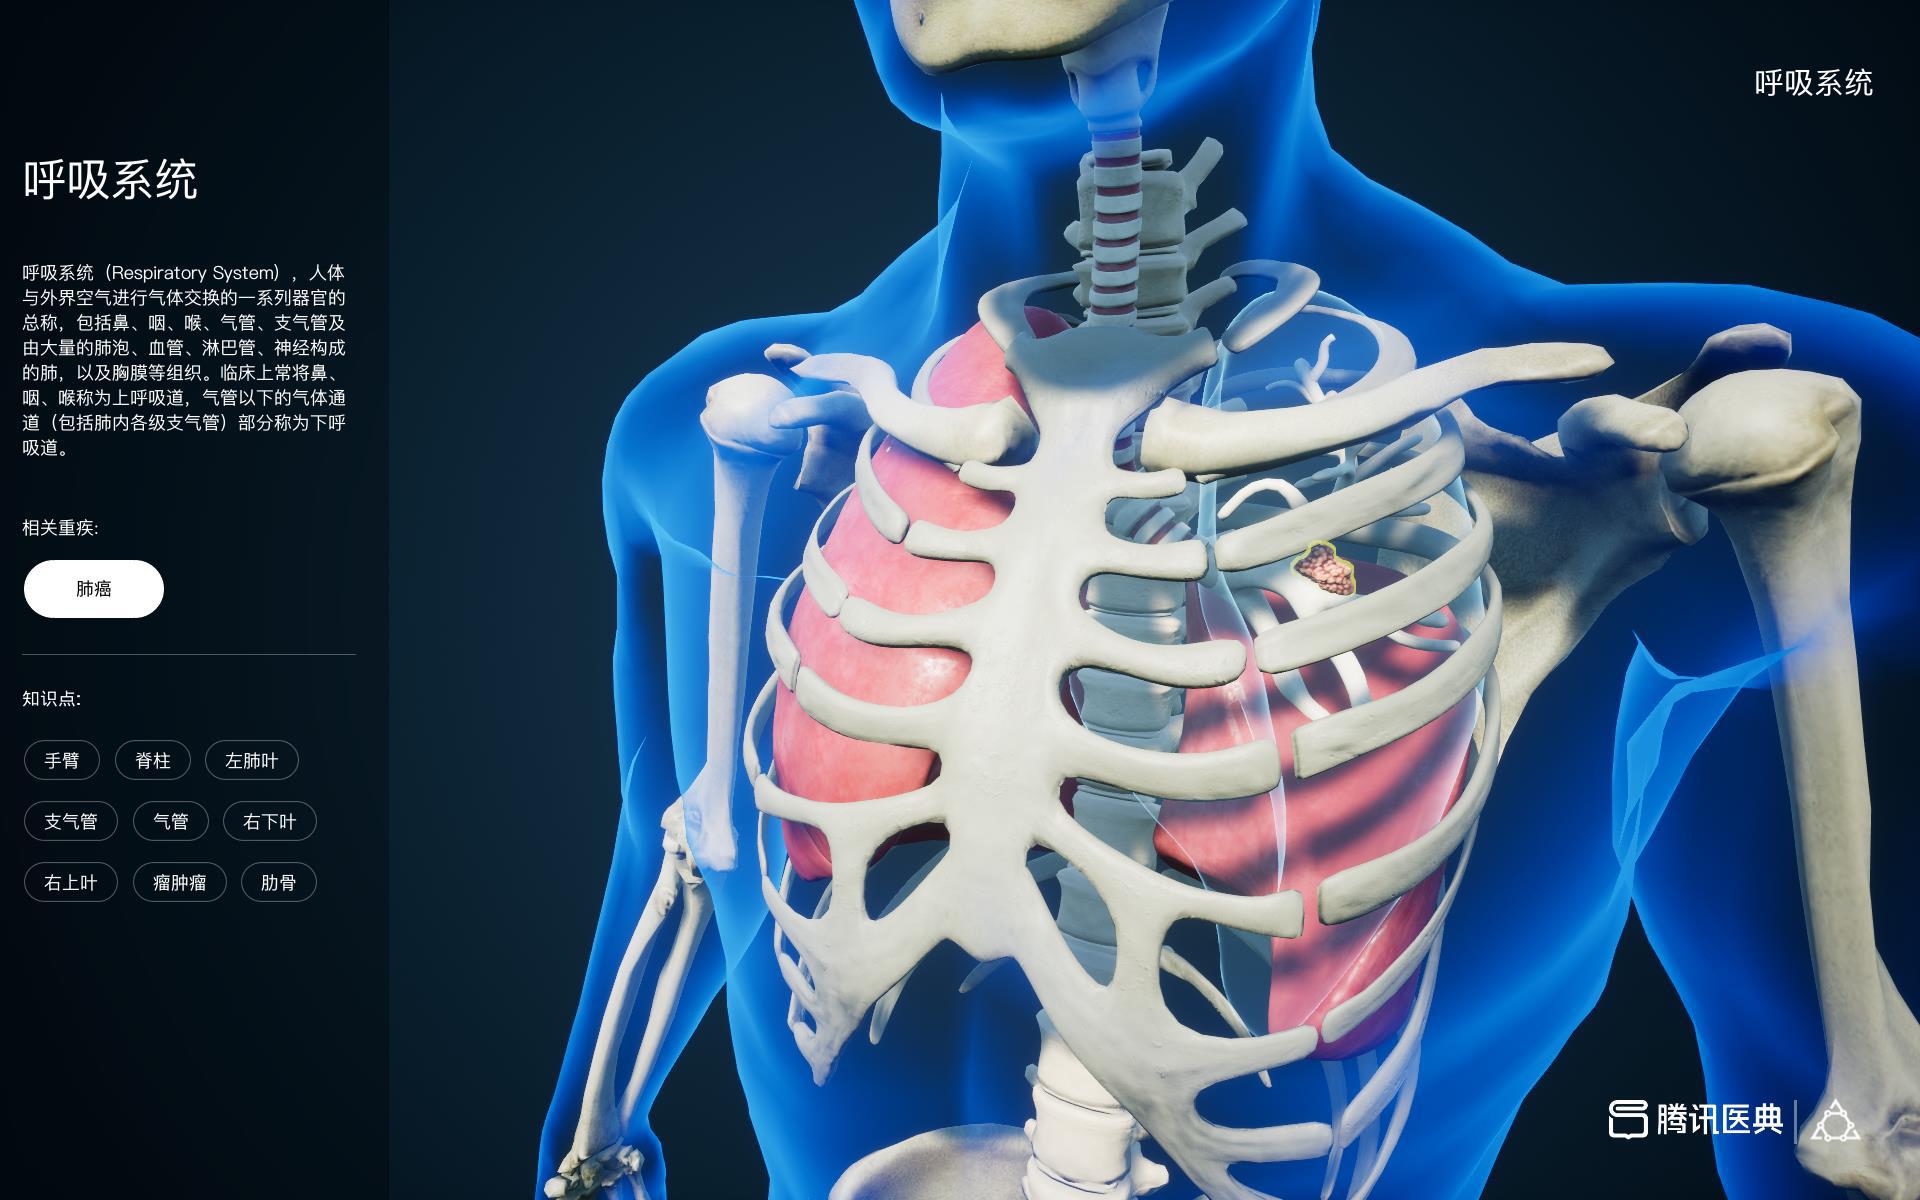
Hospital Control Cabin
In this video, you can see how a hospital can connect building and patient data to visualize hospital capacity and use it in the hospital as a control center for triage and resource management
Shenzhen Expo Centre
Connecting live building data (BAS) to a Revit model provided by the client (BIM), we can visualize building activity, as well as model possible exhibit layouts and track users with bluetooth triangulation
Note: Sample data was provided for the BAS feed, and the exhibit uses a mock-up example, As the site was still under construction at this time
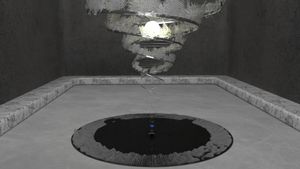
Live Satellite Visualization
This project helps monitor satellite activity on a global-scale in real-time. It loads TLE datasets to calculate satellite positions, and frequently pulls TLE data to maintain accurate trajectories.
You can view data such as position, velocity, Country of origin, and instrument types.
The video shows two sides to the application: One is the render running in UE. Which is displayed on a large screen in the control centre, Or can be viewed in VR. The other is a web-based console which can be used to make a remote procedure call into unreal to control the viewer.


